
Figure 5.
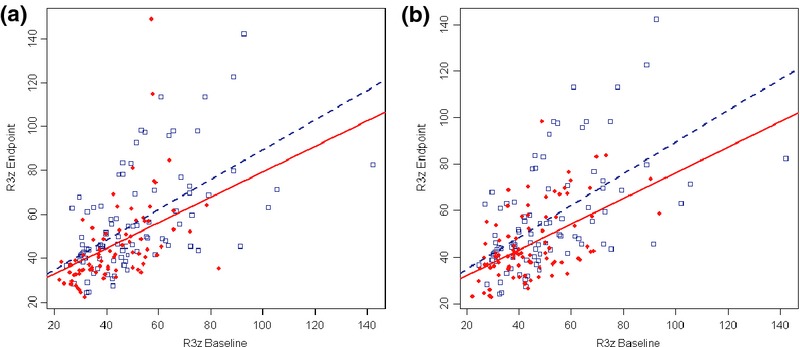
Best fit lines of treatment-baseline interaction on R3z. (a) Test group1 vs. Placebo (P = 0.057). (b) Test group2 vs. Placebo (P = 0.01).
Official websites use .gov
A
.gov website belongs to an official
government organization in the United States.
Secure .gov websites use HTTPS
A lock (
) or https:// means you've safely
connected to the .gov website. Share sensitive
information only on official, secure websites.
Best fit lines of treatment-baseline interaction on R3z. (a) Test group1 vs. Placebo (P = 0.057). (b) Test group2 vs. Placebo (P = 0.01).