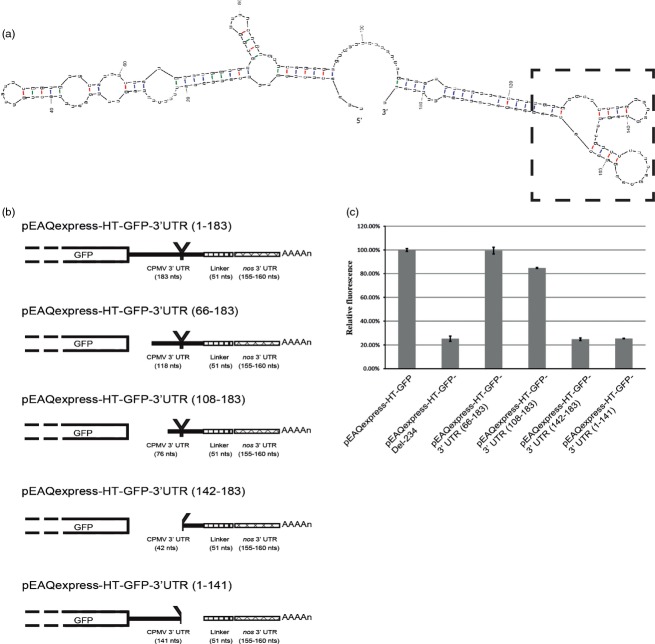
Figure 3.
Deletion mutagenesis of the 3′ UTR. (a) Predicted secondary structure of the 3′UTR of CPMV RNA-2. The Y-shaped loop has been highlighted. (b) Schematic representation of the series of mutants constructed upon deletion of different sections within the 3′ UTR of CPMV RNA-2. (c) Relative GFP expression levels based on spectrofluorometric analysis of extracts from leaves harvested at 6 dpi. Values indicate relative expression levels averaged from three technical replicates ± standard error.

