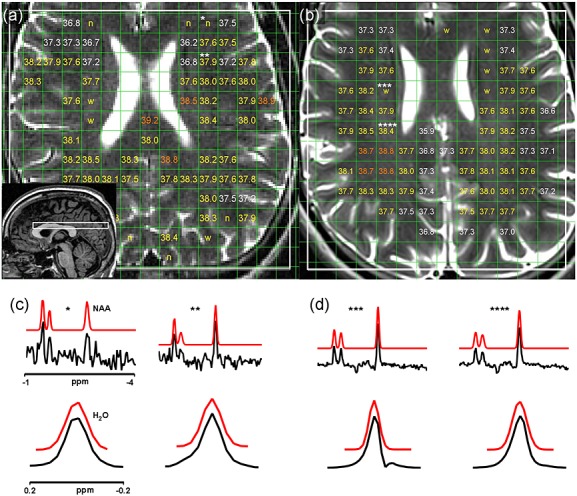
Figure 1.

The 1.5-T (a) and 3-T (b) T2-weighted (T2W) images of one subject overlaid with MRSI excitation volumes (white) and temperature estimates. ‘n’ indicates voxels rejected as a result of poor quality of N-acetylaspartate (NAA) fitting, and ‘w’ indicates voxels rejected as a result of distortions of the water resonance. Voxels covering >5% cerebrospinal fluid (CSF) or non-brain regions are empty (note that some voxels are rejected because of CSF that is not visible in the 2-mm-thick T2W image displayed). The sagittal localiser image used to position the volume of interest is shown as the inset in (a). (c) and (d) show acquired (black) and simulated (based on fitted parameters; red) spectra corresponding to representative voxels labelled in (a) and (b), respectively. The voxel labelled ‘*’ was rejected because of poor NAA fit quality, as the resonance is close to the noise level; the voxel labelled ‘***’ was rejected because of a distorted asymmetric water resonance; the remaining two voxels were accepted. Chemical shifts are displayed relative to the water resonance.
