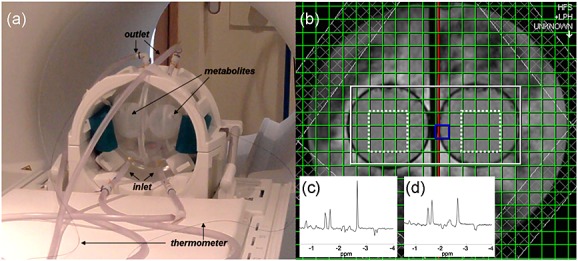
Figure 2.

(a) Temperature-controlled phantom positioned in the 3-T scanner, showing points of entry and exit of temperature-controlled water, inner metabolite-containing spheres and fibre-optic thermometer probes leading to the metabolite spheres. (b) The 3-T axial localiser image showing the MRSI excitation volume (white) and central voxels included in the analysis (dotted white line). Typical 1.5-T (c) and 3-T (d) spectra are shown as insets; chemical shifts are displayed relative to the water resonance.
