
Figure 5.
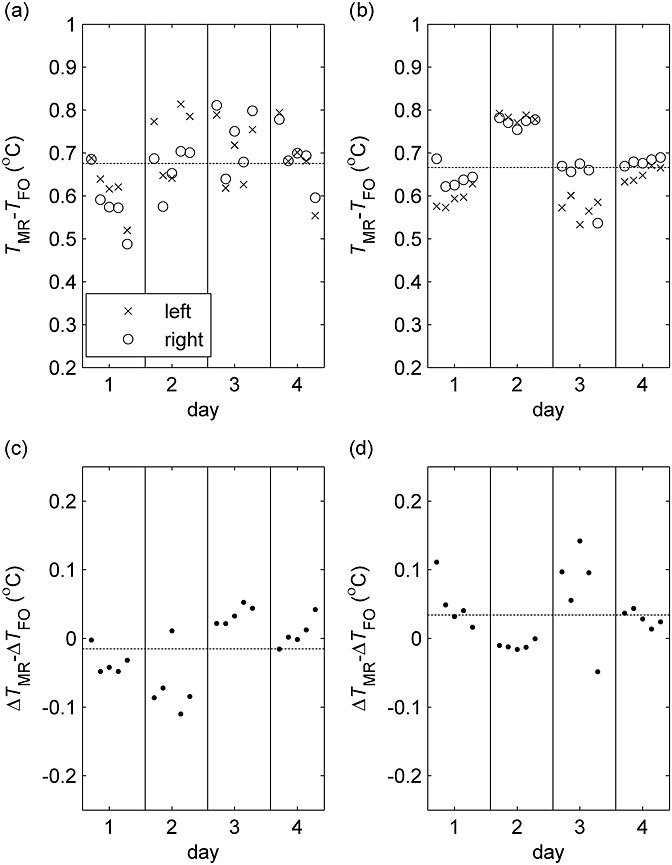
Error in MR temperature (TMR) measured in the temperature-controlled phantom relative to temperature measured by a fibre-optic thermometer (TFO) at 1.5 T (a) and 3 T (b). Mean values for the central voxels on either side of the phantom are shown for the five consecutive MRSI scans (ordered sequentially from left to right) performed on each of the four days. (c) and (d) show corresponding errors in the lateral temperature difference (right minus left) at 1.5 and 3 T, respectively. Dashed lines indicate the mean values of all data points.