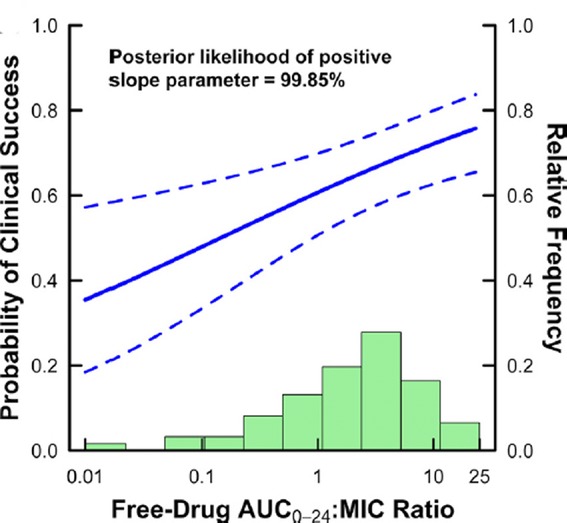
Figure 2.

Pharmacometric approach to estimating the placebo effect size. Shown is an approach to estimating the size of the placebo treatment effect from actual clinical trial data. In the analysis, clinical success is analyzed versus observed isolate MIC and estimated drug exposure measured as 24-h area under the curve (AUC0–24). The right-hand y-axis corresponds to the frequency histogram of observed AUC0–24/MIC ratios. The left-hand y-axis shows observed clinical response as an estimate logistic regression function (solid line) and its 95% confidence bounds (dotted lines). The placebo treatment effect size can be estimated by examining the success rate when the AUC0–24/MIC approaches zero. In this case, the success rate with placebo is estimated at slightly less than 40%. Figure reprinted with permission from Ref. 31.
