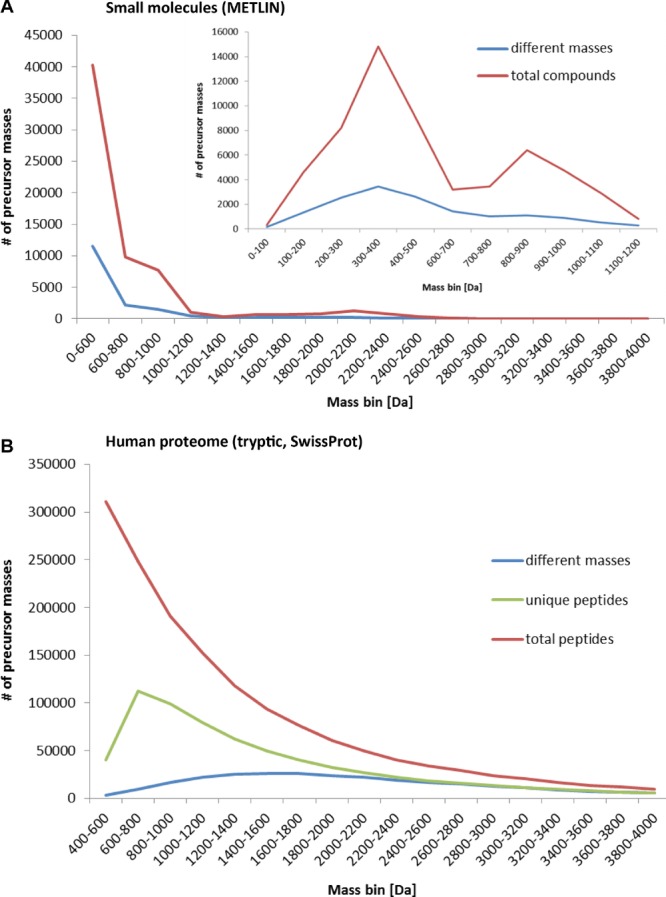
Figure 2.

Mass redundancy of biomolecules – a challenge for identification by MS. (A) All 64 092 molecular entries of the METLIN database were sorted based on their molecular masses and then categorised in mass bins of 200 Da (X-axis). The total number of compounds per mass bin (red line) and the number of different masses (blue line) are displayed, indicating an uneven distribution of compounds and those sharing identical masses across the mass range (insert: higher resolved plot for mass range 0–1200 Da). (B) All protein entries from the SwissProt (UniKProt, 21 March 2012 release, containing 35 956 unique proteins incl. isoforms) database were digested in silico with trypsin (Protein Digestion Simulator by Matthew Monroe, PNNL (USA)) yielding 1 501 402 protein fragments between 400 and 4000 Da, sorted based on their molecular masses and then categorised in mass bins of 200 Da (X-axis). The total number of peptides per mass bin (red line), the number of unique peptides (green line) and the number of different masses (blue line) are displayed, indicating an uneven distribution of total and peptides with different molecular weights across the mass range.
