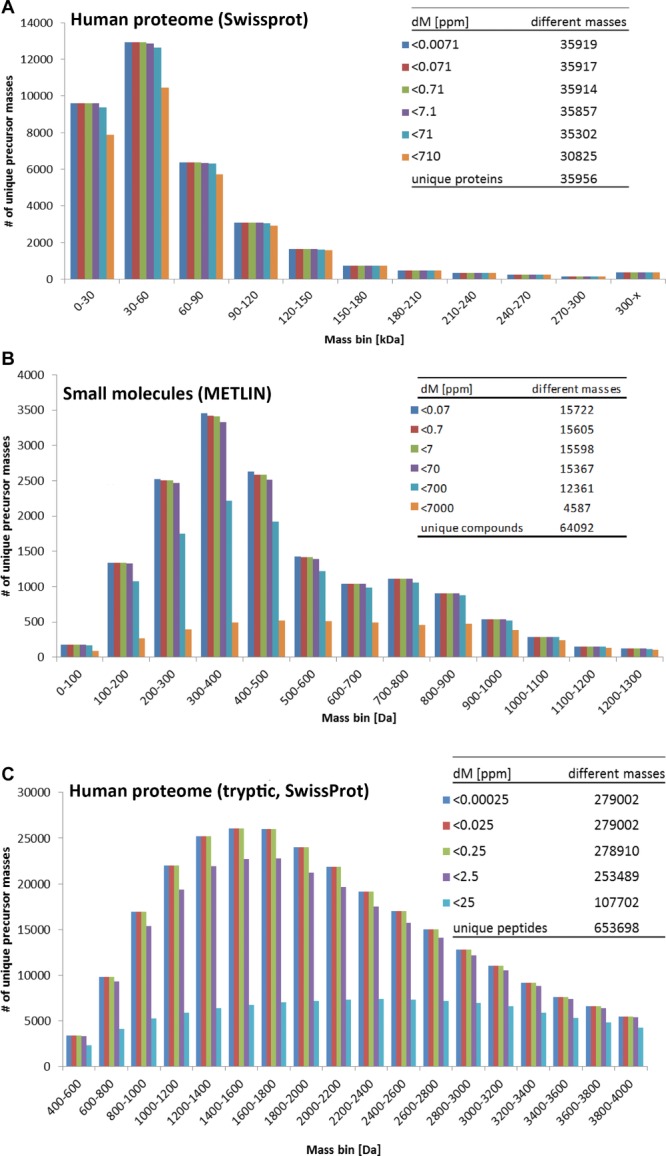
Figure 3.

Effect of mass accuracy on measuring and identifying biomolecules. (A) Display of the number of different protein precursor masses present in the SwissProt (UniKProt) database that can be separated based on mass accuracy (ppm calculations are based on protein LST1, 1.419 kDa). The proteins are indicated in groups of 30 kDa mass bins (X-axis). (B) Display of the number of different small molecular compound masses present in the METLIN database that can be separated based on mass accuracy (ppm calculations are based on methane, 16.0313 Da). The compounds are indicated in groups of 100 Da mass bins (X-axis). (C) Display of the number of different peptide precursor masses derived from an in silico trypsin digestion of proteins present in the SwissProt (UniKProt) database that can be separated based on mass accuracy (ppm calculations are based on the unique peptide HNM (Q9C037–3), 400.1528814 Da). The peptides are indicated in groups of 200 Da mass bins (X-axis). A similar analysis was performed after in silico digestion of proteins with other proteolytic enzymes (Supporting Information Fig. 3 and Supporting Information Tables 1 and 2).
