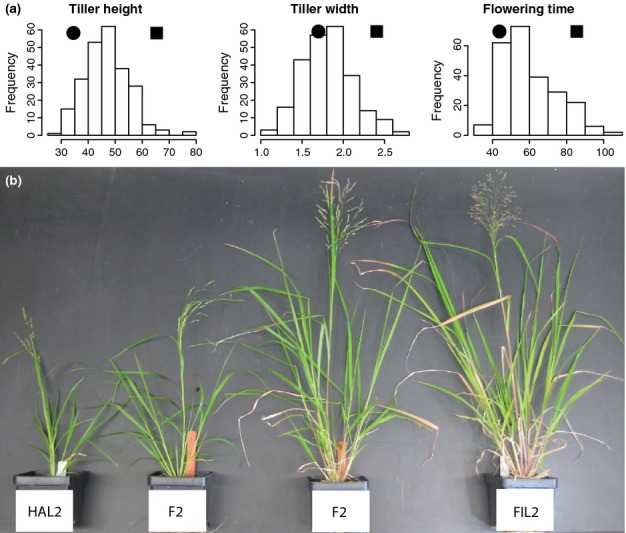
Fig 1.

(a) The distribution of trait values in the F2 hybrid mapping population for tiller height, tiller width, and flowering time. The parental HAL2 (black circle) and FIL2 (black square) means are plotted above each distribution. (b) The divergence between Panicum hallii var. hallii (HAL2) and var. filipes (FIL2) was largely recovered in F2 individuals.
