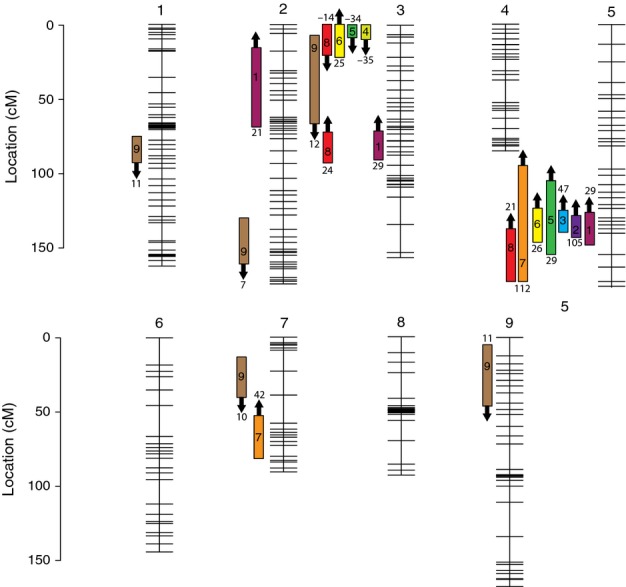
Fig 2.

Genetic map of the FIL2 × HAL2 F2 hybrid population of Panicum hallii with the location of morphological trait quantitative trait loci (QTLs). Rectangular box indicates 1.5–LOD drop confidence intervals. Location of numbers within boxes is the location of QTL peaks. Arrow is the direction of additive effect, with an up arrow indicating that the FIL2 allele increases the trait value. Number above or below each QTL is the percentage of parental divergence (HAL2 vs FIL2) explained by the QTL. Traits: 1, tiller height; 2, number of tillers; 3, tiller width; 4, leaf length; 5, leaf width; 6, flowering time; 7, inflorescence length; 8, number of flowers; 9, seed mass. cM, centimorgans.
