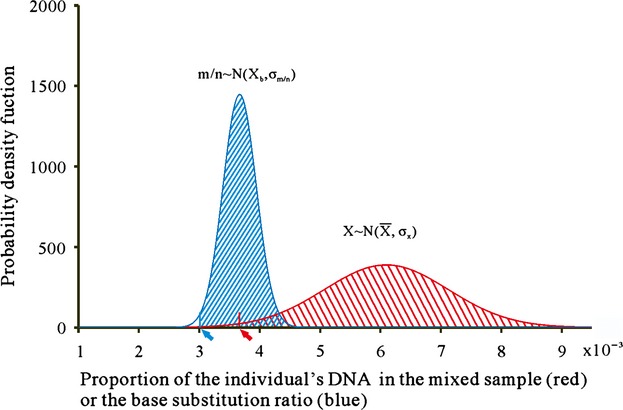
Figure 3.

The probability density function of the normal distribution of DNA proportions of genuine mutations in the bulked samples (red area) and the ratio of base substitution numbers in total sequencing depth (the m/n ratio, blue area). The red and blue arrows indicate the one-tail left-hand borders equivalent to 97.5% of the DNA proportion and the m/n ratio, respectively.
