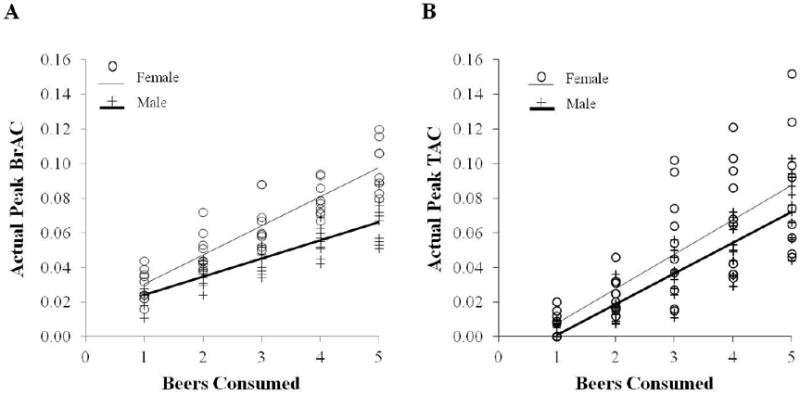
Figure 2.

Linear regressions of (a) Peak BrAC levels in % BAC and (b) Peak TAC levels in g/dl shown by numbers of beers consumed in the five drinking conditions, plotting men (+, N = 54 observations) and women (O, N = 50 observations), separately.

Linear regressions of (a) Peak BrAC levels in % BAC and (b) Peak TAC levels in g/dl shown by numbers of beers consumed in the five drinking conditions, plotting men (+, N = 54 observations) and women (O, N = 50 observations), separately.