
Figure 4.
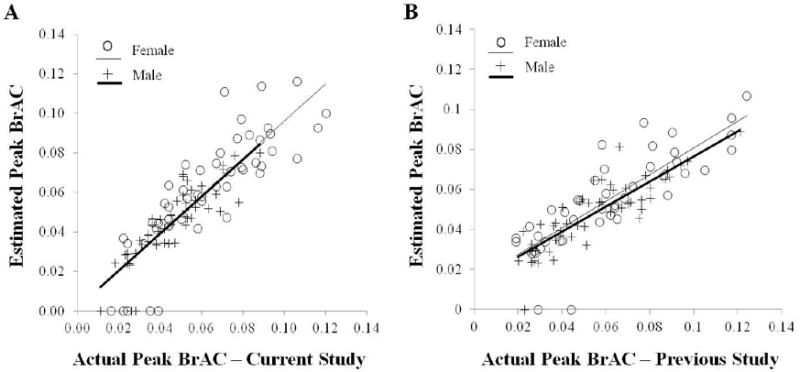
Scatterplot of association between actual peak BrAC (% BAC) and estimated peak BrAC (% BAC) using the model described herein for (a) the current study's data and (b) our previous study's data (Dougherty et al., 2012). Data are all values collected from all participants across all drinking conditions broken down as two regression slopes separately for men and women.