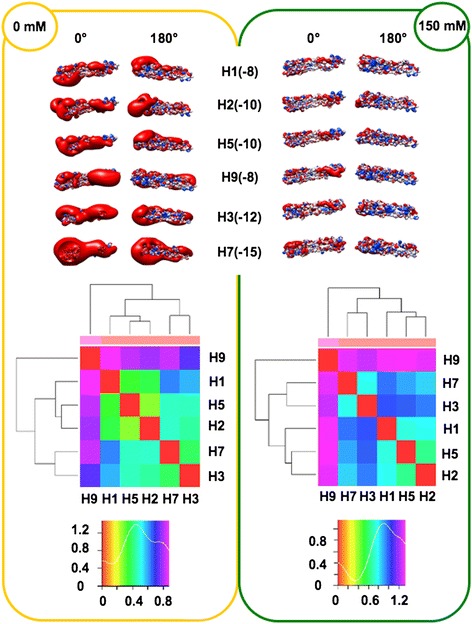
Figure 1.

Isopotential contours (top), heat maps (middle) and density plots (bottom) of HA stems. Electrostatic features are shown at I = 0 mM (left panel, yellow) and I = 150 mM (right panel, green). Electrostatic potentials (blue for positive and red for negative) are presented in two orientations (0° and 180°). Isopotential contours are plotted at ±3kBT/e. In heat maps, red, warm and cold colors correspond to identity, low and high Electrostatic Distances (ED), respectively. The number of hits (pairs of compared structures) is plotted and referred to as ‘Density’.
