Figure 2.

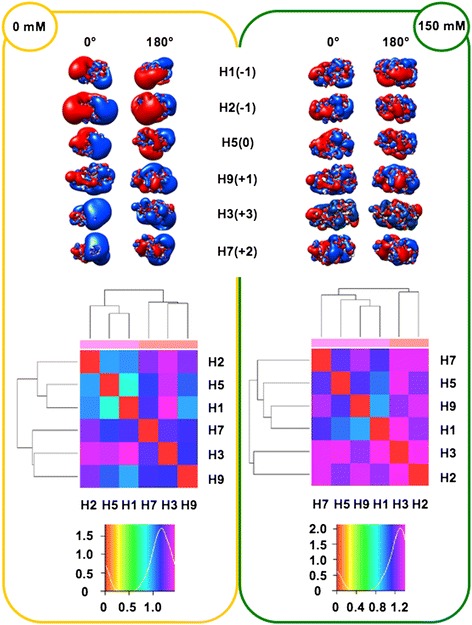
Isopotential contours (top), heat maps (middle) and density plots (bottom) of HA RBDs. See Figure 1 caption for color code and definitions. Isopotential contours are plotted at ±1kBT/e.

Isopotential contours (top), heat maps (middle) and density plots (bottom) of HA RBDs. See Figure 1 caption for color code and definitions. Isopotential contours are plotted at ±1kBT/e.