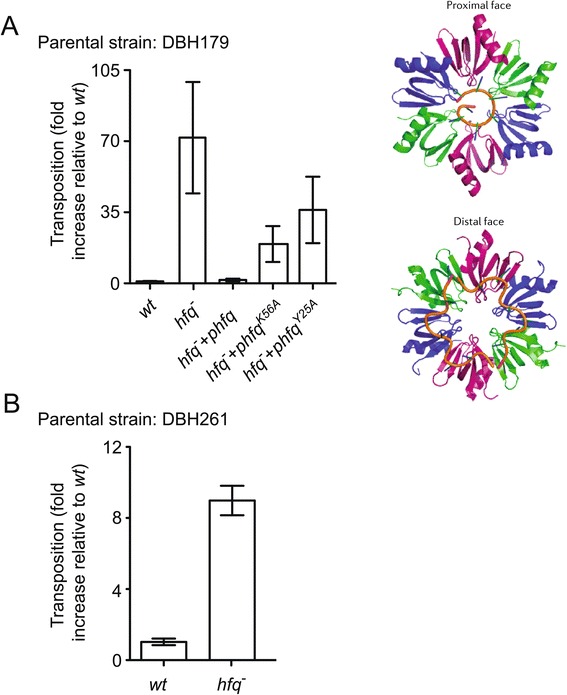
Figure 2.

Frequencies of Tn5 transposition in hfq − versus wt strains of E. coli . (A) Tn5 transposition from the chromosome of DBH179 and derivatives (hfq − and dam −) was measured by the conjugal ‘mating out’ assay as described in Methods. For purposes of trans-complementation, strains contained an empty vector or a low-copy plasmid encoding either wild type hfq WT or mutant forms of hfq (K56A or Y25A) expressed from the hfq P3 promoter. The data was compiled from four independent experiments, each with at least three isolates of each strain. The average transposition frequency was 8.33 × 10⁻⁵ events per mL of mating mix for the wt strain (no ‘hfq plasmid’) and for purposes of comparison this value was set at 1 and all other values normalized to this. The illustration shows the structure of an Hfq hexamer with RNA (gold) bound either to the proximal or distal face [9]. The Y25A mutation inhibits RNA binding to the distal face and the K56A mutation inhibits RNA binding to the proximal face. Adapted from Nature Reviews: Microbiology [9] with permission from Macmillan Publishers. (B) Tn5 transposition from the chromosome of DBH261 and derivatives (hfq − and dam −) was measured as in (A). The data shown is from one experiment with five independent isolates of each strain. The average transposition frequency for the wt strain was 2.57 × 10⁻⁶ events per mL of mating mix. In (A) and (B) the error bars indicate standard error of the mean.
