
Figure 2.
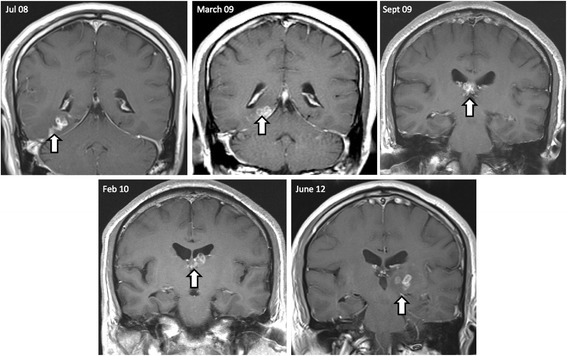
Sequential imaging over a 4-year period identifies migrating lesions. Sequential imaging over 4-year period: July 2008 to June 2012. All images are coronal T1 scans post gadolinium. The shifting white arrow, from right to left hemispheres, depicts the migration pattern of a cluster of ring-enhancing lesions.