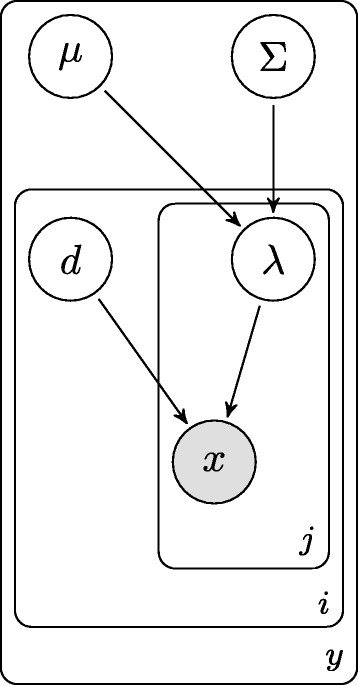
Figure 2.

Multivariate poisson model plate diagram. A plate diagram for the multivariate Poisson model. The outermost plate represents the classes that we are interested in classifying against, where i is the index of the sample in class y, and j are the genes being modeled.
