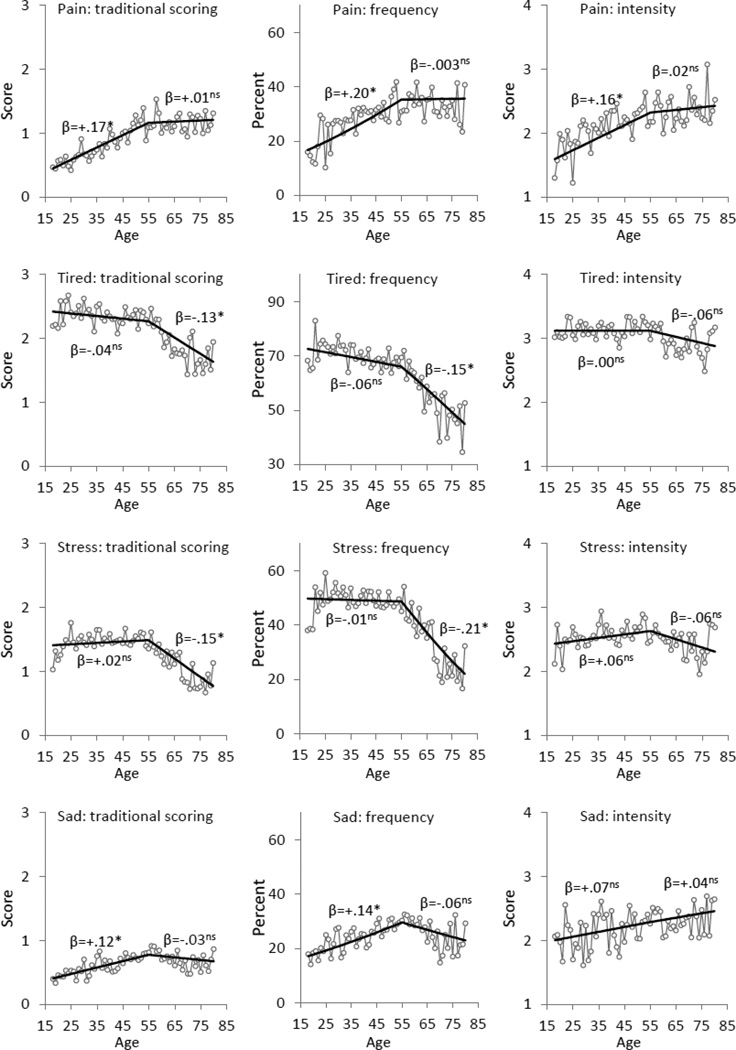
Figure 3.
Age differences in pain, tiredness, stress, and sadness based on traditional average scores and based on two-part model distinction of frequency and intensity. Solid lines represent estimated slopes based on piecewise linear regression models (inflection point of 54 years of age), and open circles represent scores plotted for each year of age (average n = 191 per year of age, range of n = 73 to 283). * p < .001.

