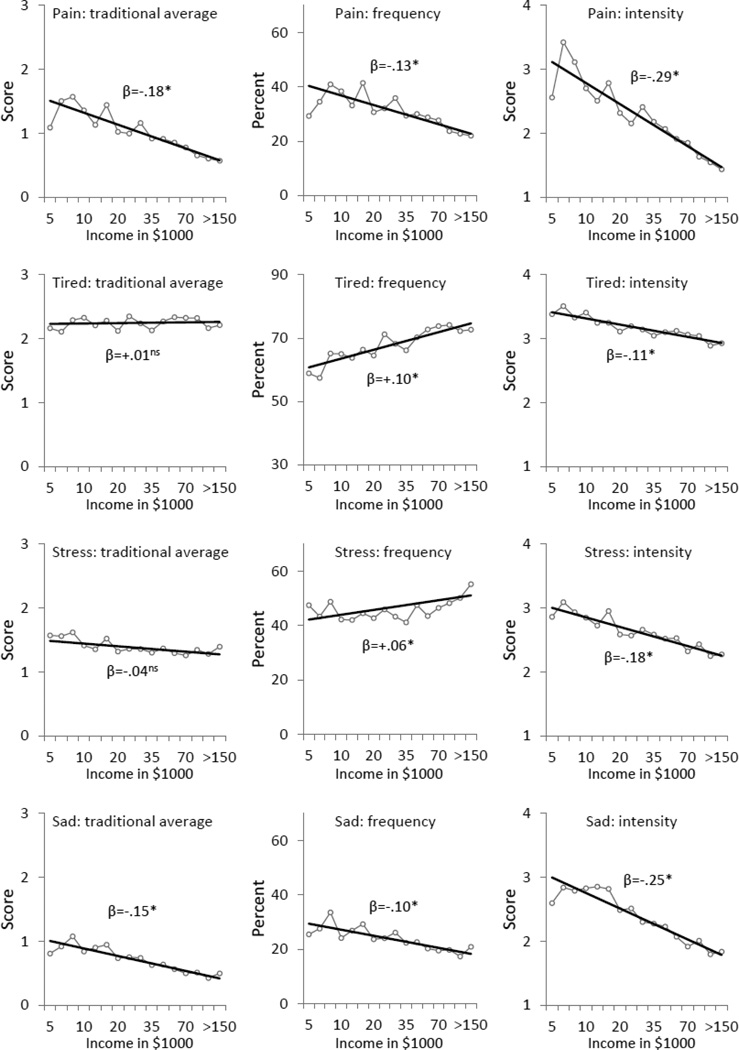
Figure 4.
Income in relation to pain, tiredness, stress, and sadness based on traditional average scores and based on two-part model distinction of frequency and intensity. Solid lines represent estimated linear effects, and open circles represent scores plotted for each income category (average n = 768 per income category, range of n = 254 to 1434). * p < .001.

