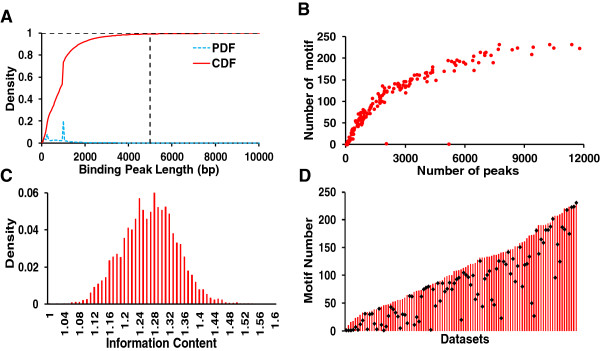
Figure 3.

Analysis of the original datasets and motif finding results. A. Distribution of the binding peak lengths in the 168 original datasets. Vast majority (99.38%) of the binding peaks are shorter than 5,000 bp. B. Number of motifs found in each of the 168 datasets as a function of the number of binding peaks the datasets. C. Distribution of the information content of the predicted motifs in the datasets. D. The rank of the ChIP-ed TF’s motif among the predicted motifs in the 99 datasets in which the motifs of the ChIP-ed TFs can be identified. The diamond on the bar indicates the rank of the ChIP-ed TF’s motif among the predicted motifs in the dataset. The higher the position of the diamond, the higher the rank of the target TF’s motif.
