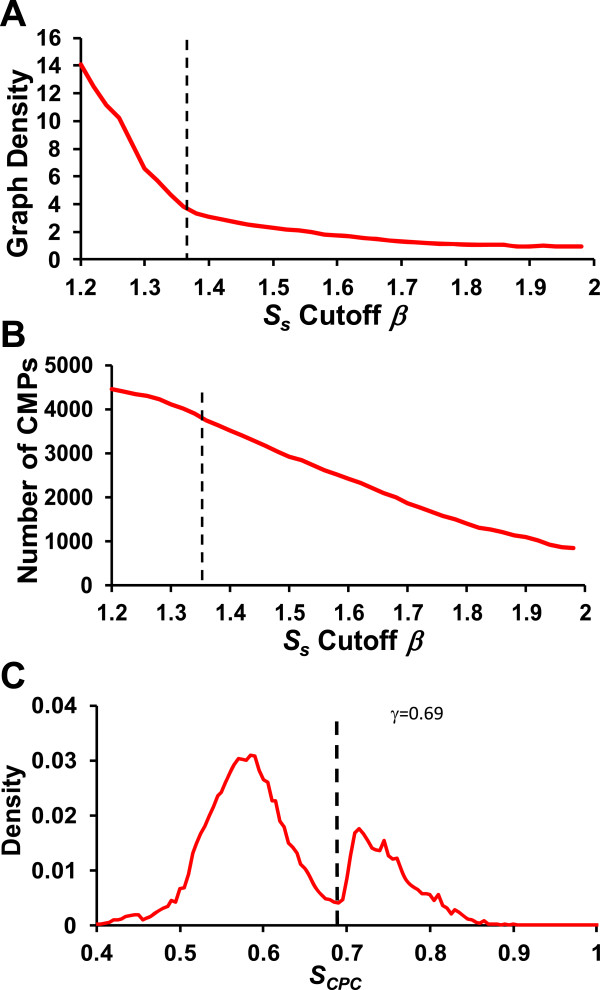
Figure 7.

Setting S S cutoff β and S CPC cutoff γ. A. The density of the CP similarity graph drops rapidly with the increase in the S s cutoff β, but the trend of decrease slows down around β =1.36. B. The number of CRM in the graph also starts to drop rapidly around β = 1.36. Thus we set β =1.36 for construing the final CP similarity graph. C. The distribution of CPC co-occurring scores S CPC are well separated into a low-scoring component and a high-scoring component. The vertical line indicates the S CPC cutoff γ =0.69 at the deepest valley between the two peaks, for constructing the CPC co-occurring graph.
