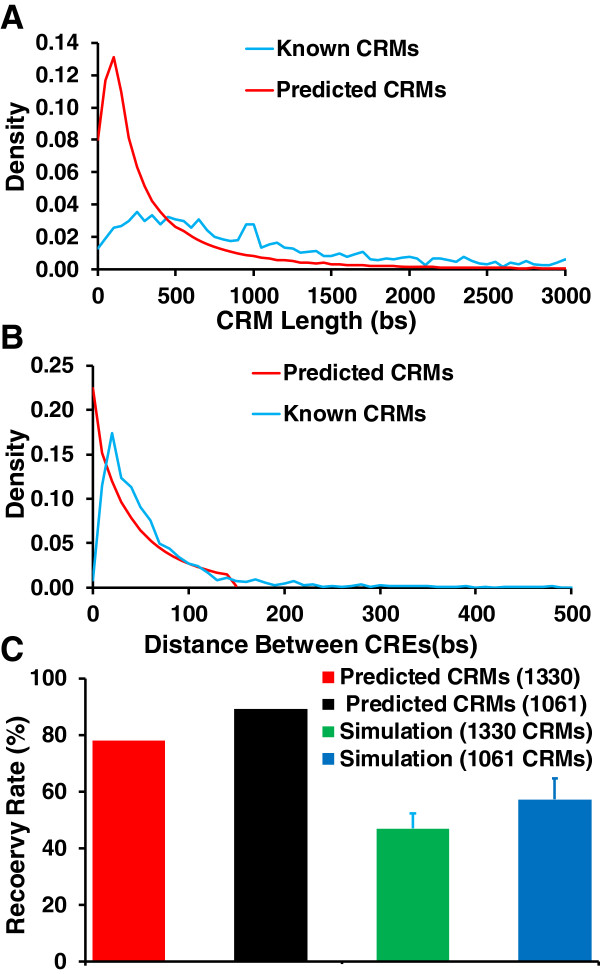
Figure 8.

Summary of the predicted CRMs. A. Distribution of the lengths of the known and predicted CRMs. B. Distribution of the distances (bp) between two adjacent CREs in the known and predicted CRMs. C. Recovery rates of the known CRMs in the datasets (1330) and the known CRMs containing a predicted CRE (1061) by the predicted CRMs and the corresponding same number and length sequences randomly selected from NCRs.
