Figure 1.

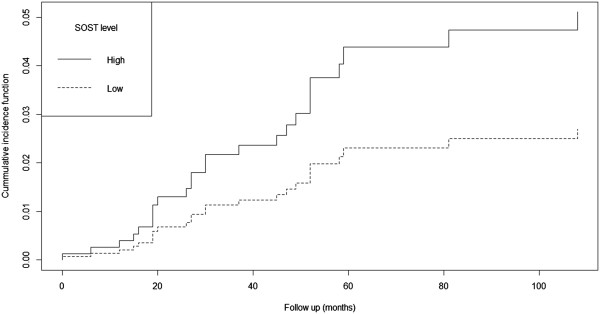
Cumulative incidence function for Scl levels during follow up. The regression included age, gender, Scl levels stratified in two categories (high versus low), FGF23 levels and presence of diabetes.

Cumulative incidence function for Scl levels during follow up. The regression included age, gender, Scl levels stratified in two categories (high versus low), FGF23 levels and presence of diabetes.