Figure 3.

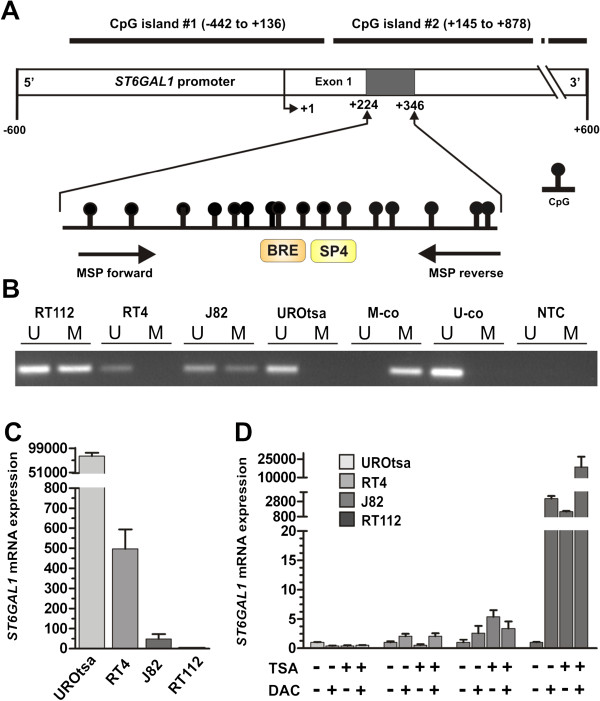
ST6GAL1 promoter methylation in human bladder cell lines correlates with ST6GAL1 mRNA expression. (A) Schematic map of the human ST6GAL1 promoter region including the relative positions of analyzed CpG dinucleotides using MSP (MSP primer binding sites are indicated by arrows) that is located within the non-coding exon 1 region. Two predicted CpG islands are located between base -442 and base +136 as well as between base +145 and base +878 in relation to the transcription start site (TSS). +1: ST6GAL1 TSS. Orange and yellow boxes illustrating gene transcription-relevant regulatory elements statistically identified by using the Genomatix data base (http://www.genomatix.de/): BRE: Transcription factor II B (TFIIB) recognition element (score: 1.0, position in relation to TSS: 282–288 bp); SP4: Ubiquitous GC-Box factors SP1/GC recognition element for SP4 TF (score: 0.89, position in relation to TSS: 287–303 bp). (B) Representative MSP analysis illustrating the ST6GAL1 promoter methylation status of human bladder cell lines RT112, RT4, J82 and UROtsa. Band labels with U and M represent an unmethylated and methylated DNA locus. Bisulphite-converted unmethylated, genomic (U-co) and polymethylated, genomic (M-co) DNA were used as positive controls. NTC: non-template control. (C) Comparison of ST6GAL1 mRNA expression of human bladder cell lines showing an unmethylated ST6GAL1 promoter hypermethylation (UROtsa and RT4) with ST6GAL1 methylated J82 and RT112 cells. Vertical lines: + s.e.m. (D) DNA demethylation of the ST6GAL1 promoter correlates with ST6GAL1 re-expression in vitro. Real-time PCR of ST6GAL1 mRNA expression demonstrated a clear ST6GAL1 re-expression after treatment with both DAC (+) and TSA (+) only in the RT112 bladder cell line. Non-treated cells were set to 1. Error bars: + s.e.m.
