
Figure 5.
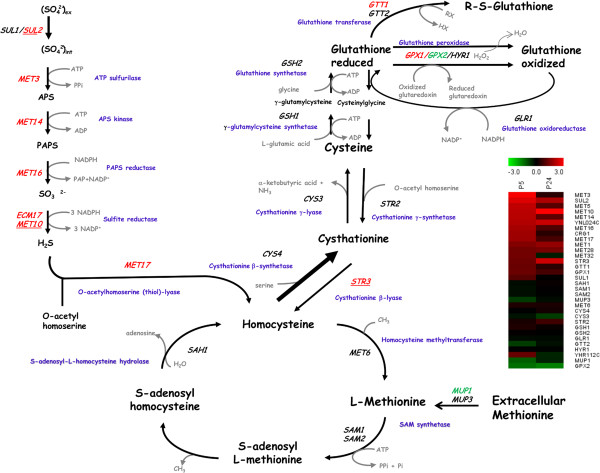
The sulfur assimilation pathway and the genes encoding the enzymes of the different biosynthetic steps. The genes in red and green represent up-regulation and down-regulation in strain P5 at low temperature, respectively. Underlined genes mean identical regulation in P24. Heat map shows the expression of the genes of this pathway that were differentially expressed in both strains.