
Figure 3.
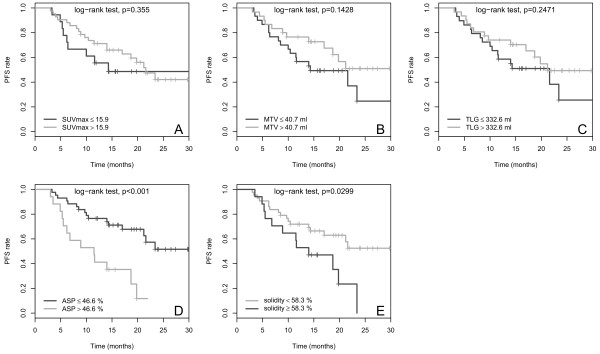
Kaplan-Meier curves for the quantitative PET parameters SUVmax (A), MTV (B), TLG (C), ASP (D) and solidity (E) with respect to PFS. Cut-off values and p-values are shown on each panel.
Official websites use .gov
A
.gov website belongs to an official
government organization in the United States.
Secure .gov websites use HTTPS
A lock (
) or https:// means you've safely
connected to the .gov website. Share sensitive
information only on official, secure websites.
Kaplan-Meier curves for the quantitative PET parameters SUVmax (A), MTV (B), TLG (C), ASP (D) and solidity (E) with respect to PFS. Cut-off values and p-values are shown on each panel.