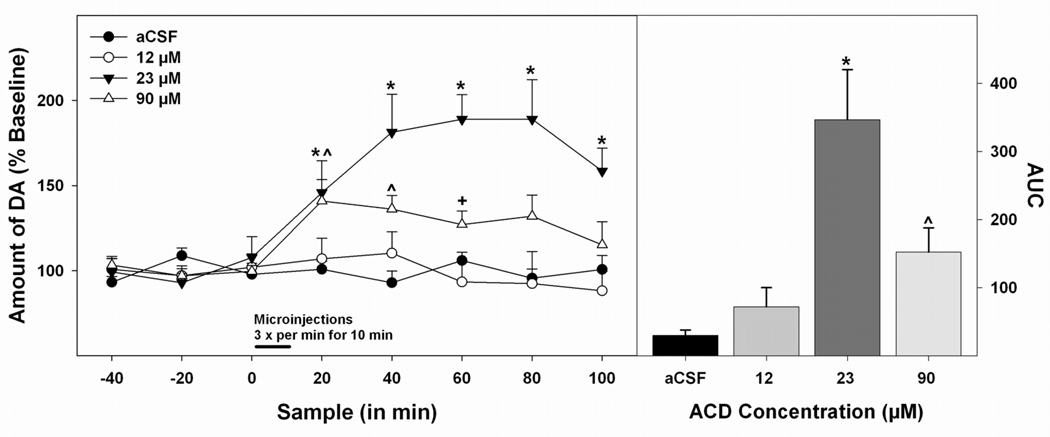
Figure 2.
Dose-response effects of microinjections of ACD into the pVTA on DA efflux in the AcbSh. Microdialysis time-course data (left panel) are presented as means (± SEMs) percent baseline levels. Bar indicates microinjection period, microinjections were given 3 times a min over the first 10 min of sample 3. The area under the curve data is presented as means (± SEMs) area under the curve (right panel). * 23 µM ACD (n = 6) significantly greater (p < 0.05) than all other groups, ^ 90 µM (n = 7) ACD significantly greater (p < 0.05) than aCSF group (n = 6), + 90 µM ACD significantly greater (p < 0.05) than 12 µM ACD (n = 7).

