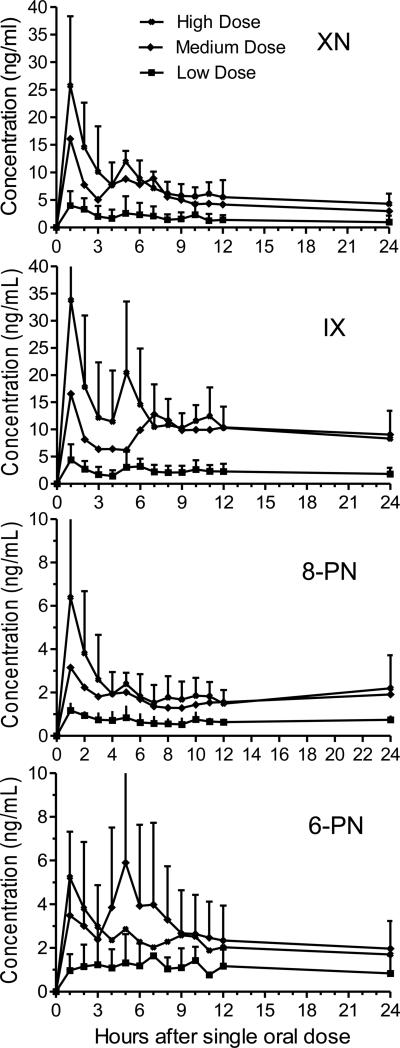
Figure 4.
Serum concentration-time curves of the 4 major prenylated hop phenols following oral administration of single doses of an extract of spent hops to 5 women. The curves represent total content of each compound (free + aglycon following enzymatic deconjugation) and were obtained by averaging concentrations from all 5 subjects. Secondary peaks occurring approximately 5-6 h post-dose suggest enterohepatic recirculation.

