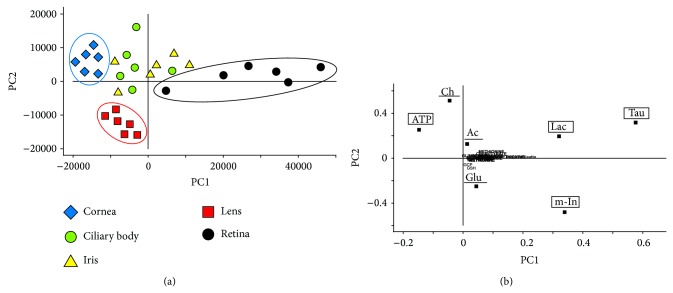
Figure 2.
Principal component analysis of human eye tissues. (a) Score plot of the 1st versus the 2nd principal component (PC1 versus PC2) of 1H NMR spectra. The groupings of the samples were marked with colorful ellipses. (b) Loading profile of the principal components of the 1H NMR spectra of the eye tissues. Metabolites described in lower cases in the loading profile indicate negligible influence of these compounds on the grouping pattern. The biochemical compounds that served as PC1 were marked with the square frames. The biochemical compounds that served as PC2 were underlined. For metabolite labels see legend for Figure 1.

