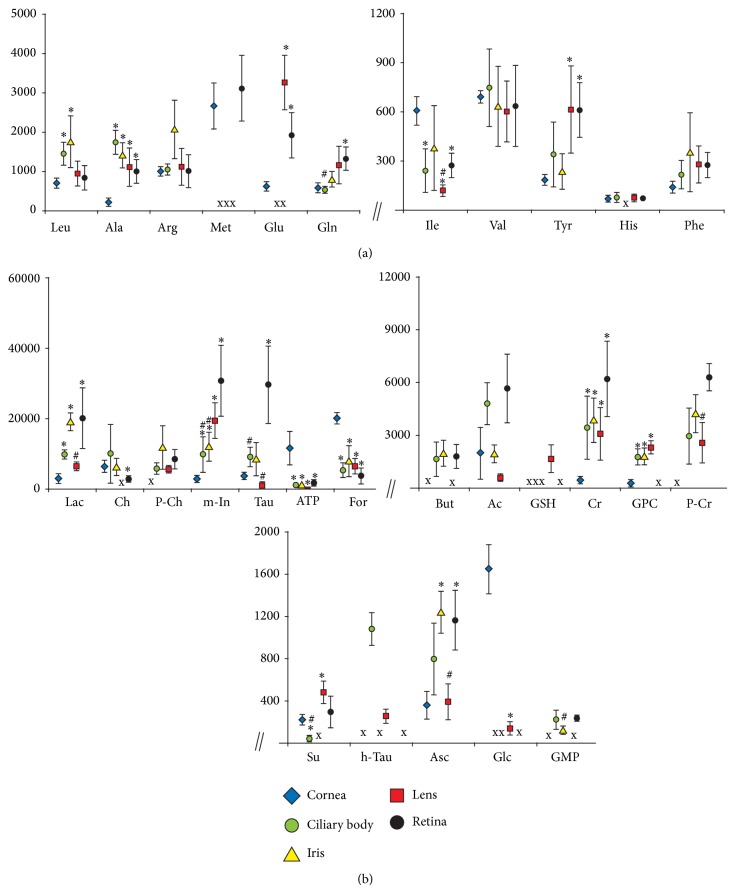
Figure 3.
The contents of assigned biochemical compounds in various eye tissues. (a) amino acids; (b) nonamino acid compounds. Data are means ± SEM of HR MAS 1H NMR peak integrals divided by tissue wet weight; * P < 0.05 versus the respective cornea group value; # P < 0.05 versus the respective retina group value; X—no detectable metabolite peak in the respective NMR spectra. For metabolite labels see legend for Figure 1.

