
Figure 7.
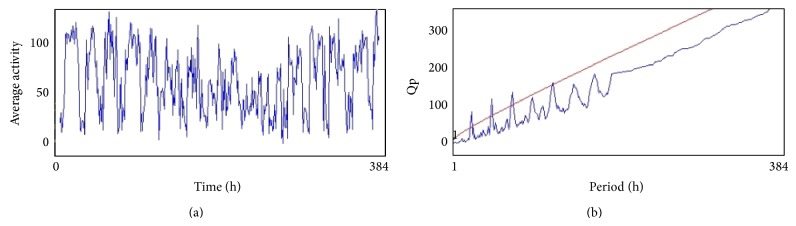
(a) and (b) show the average activity pattern and chi-square periodogram, respectively, for the PD flies exposed to 10−3 molar dopamine in diet (N = 20).
Official websites use .gov
A
.gov website belongs to an official
government organization in the United States.
Secure .gov websites use HTTPS
A lock (
) or https:// means you've safely
connected to the .gov website. Share sensitive
information only on official, secure websites.
(a) and (b) show the average activity pattern and chi-square periodogram, respectively, for the PD flies exposed to 10−3 molar dopamine in diet (N = 20).