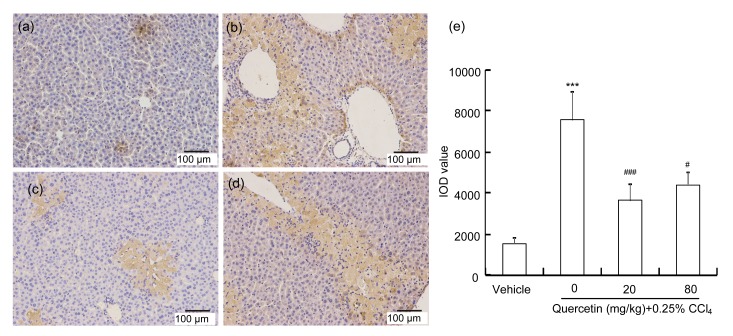
Fig. 4.
Immunohistochemical staining of 4-HNE in mice livers and IOD values of the density of 4-HNE
Typical images selected from each group: (a) vehicle control; (b) CCl4; (c) CCl4+20 mg/kg quercetin; (d) CCl4+80 mg/kg quercetin. (e) IOD values of the density of 4-HNE staining analyzed in every section of at least three random fields. Data are expressed as mean(SEM (n=4). *** P<0.001 vs. control; # P<0.05, ### P<0.001 vs. CCl4-treated group

