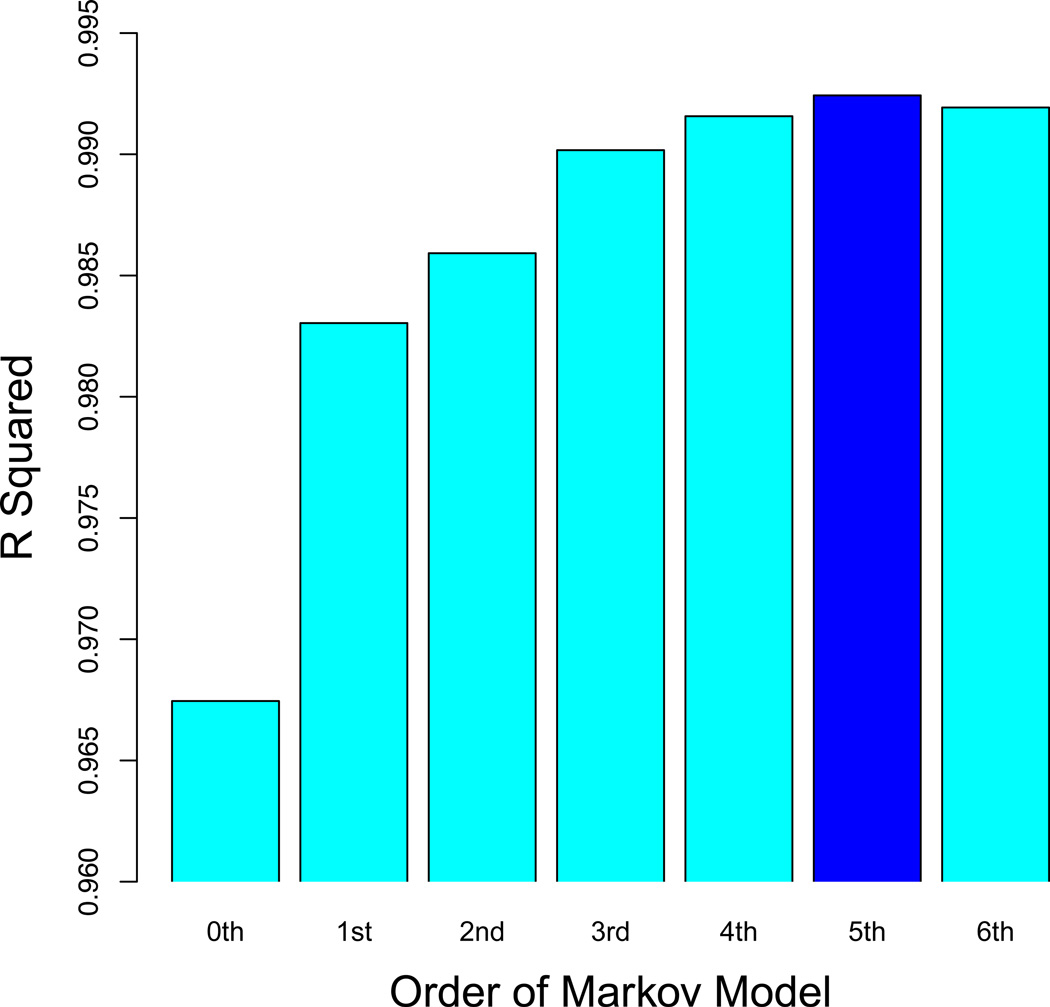
Figure 3. Markov model optimization.
To determine the optimal order for the Markov model of the initial pool, we quantified how a Markov model trained on one replicate of R0 predicted 8-mer counts in another replicate in terms of a coefficient of determination (R2). Using the data from Slattery et al. (2011), we found that a fifth-order model has the best cross-validation performance. At lower order, the biases in R0 are not sufficiently captured; at higher order, the predictions degrade due to over-fitting.

