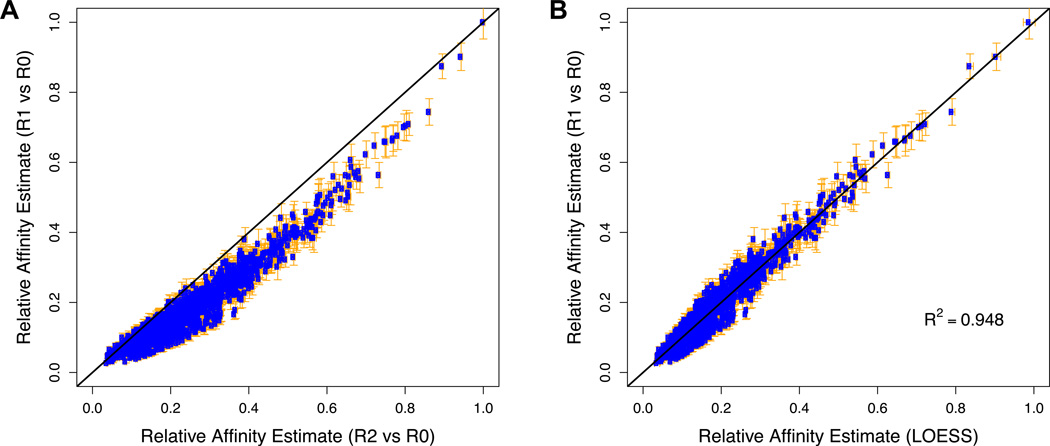
Figure 5. Integration of data from multiple rounds of SELEX.
To obtain relative affinity estimates that are both accurate and precise, we integrate information from multiple rounds of selection using LOESS regression. (A) Direct comparison between the normalized fold-enrichment from R0 to R1 and the normalized square root of the fold-enrichment from R0 to R2 of all 12-mers for Exd-Lab using the data from Slattery et al. (2011). The deviation from the straight line is presumably due to a combination of binding saturation and build-up of PCR bias. These effects are expected to be less severe in the earlier round, and therefore R1/R0 is a more accurate predictor of relative affinity. However, since counts are lower in R1 than in R2, the value of R1/R0 is also less precise. The error bars denote the standard error in the estimate of the relative affinity, calculated as described. (B) Comparison between the R1-based affinity estimates and LOESS-based estimates resulting from integration of R1 and R2 data.

