Figure 1.

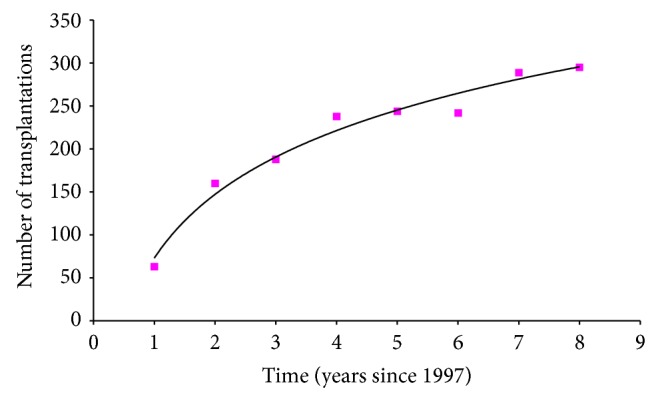
Fitted curve by the method of maximum likelihood to the data from Table 1 to project the number of transplantations, Tr, in the future (before MELD).

Fitted curve by the method of maximum likelihood to the data from Table 1 to project the number of transplantations, Tr, in the future (before MELD).