
Fig. 5.
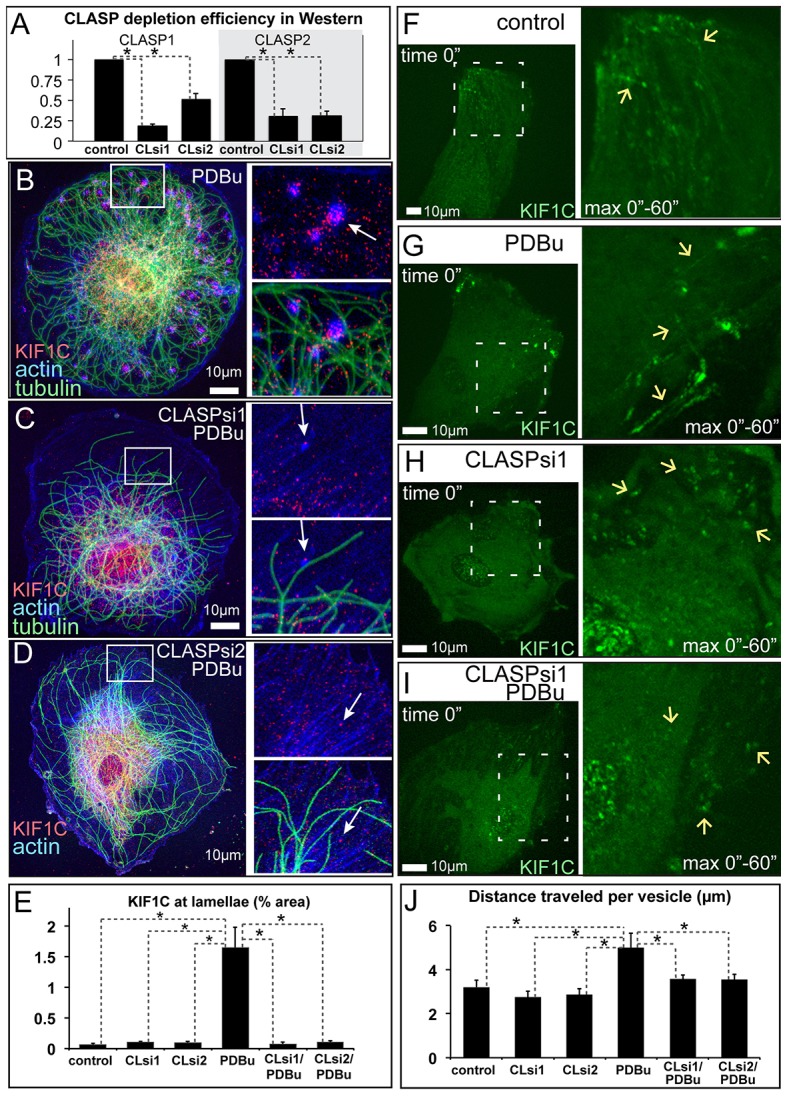
MT-dependent transport of KIF1C to podosomes requires CLASPs. (A) CLASP1 and CLASP2 depletion levels were investigated by using western blotting in cells depleted of CLASPs by siRNA combinations 1 and 2 (CLsi1, CLsi2). Data show the mean+s.e.m. (N = 3); *P<0.01 (Student's unpaired two-tailed t-test). (B–D) KIF1C (red, arrows) accumulates around podosomes in the lamellae of PDBu-treated non-targeted control cells (B), but is missing from the lamellae of CLASP-depleted cells (C,D). Boxed areas on the left are enlarged on the right. Phalloidin, blue; tubulin, green (immunostaining). Images show maximal intensity projections of confocal stacks. (E) The percentage of the area in cell lamellae taken up by KIF1C accumulation, based on data as shown in B–D. The control populations are the same as those shown in Fig. 2C,D. Data show the mean+s.e.m. (N = 10); *P<0.001 (Student's unpaired two-tailed t-test). (F–I) KIF1C–GFP (green) trafficking as visualized by a single-plane confocal image sequence. Single-frame cell overviews are shown on the left. Video sequences from the boxed regions are shown on the right as enlarged maximal intensity projections over time. Arrows indicate the tracks of KIF1C particle movement in non-targeted control cells (F,G) and the lack of directional movement in CLASP-depleted cells (H,I), in PDBu-treated (G,I) or untreated (F,H) cells. See supplementary material Movie 7. (J) Directional movement of KIF1C puncta is enhanced by PDBu in control but not CLASP-depleted cells. The graph is based on data as shown in F–I and supplementary material Fig. S4D,E. Data show the mean+s.e.m. (N = 10–17 cells); *P<0.05 (Student's unpaired two-tailed t-test).