Figure 2.
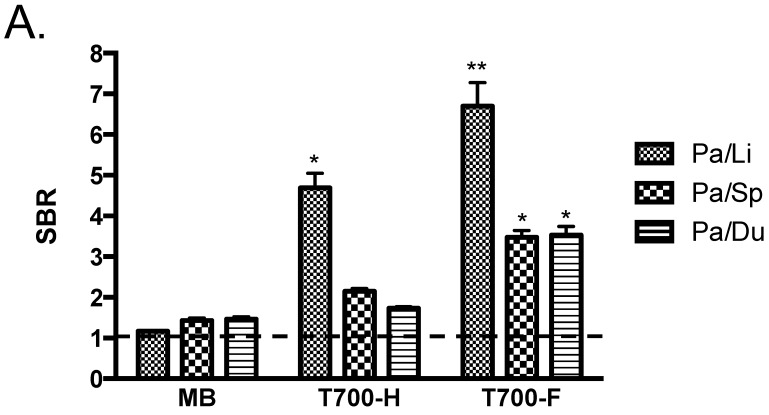
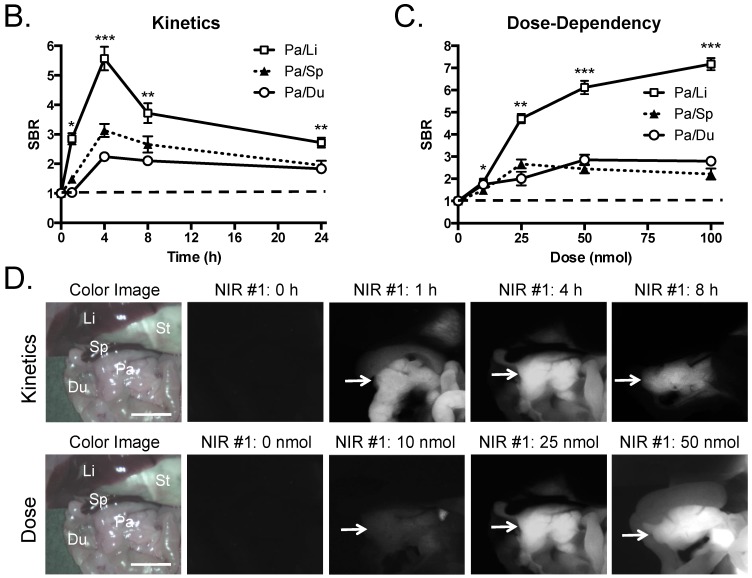
Quantitative Evaluation of NIR Fluorophore Uptake in Mouse Pancreas: a) SBR (mean ± SD) of pancreas against liver, spleen, and duodenum was compared using various NIR fluorophores. b) Quantitative time-course assessment: 25 nmol of T700-F was injected intravenously into CD-1 mice, and SBR (Pa/Li), SBR (Pa/Sp) and SBR (Pa/Du) were measured at different time points (T = 0, 1, 2, 4, 8, and 24 h). c) Dose-response curve: 0, 10, 25, 50 and 100 nmol of T700-F were injected intravenously into CD-1 mice, and SBR (Pa/Li), SBR (Pa/Sp) and SBR (Pa/Du) were measured at 4 h post-injection. d) Real-time intraoperative imaging of pancreas in different time and doses. Controls were injected with D5W alone, and at least 3 animals were used for each data point. Scale bars = 0.5 cm. *P < 0.05, **P < 0.01, and ***P < 0.001. Abbreviations used are: Du, duodenum; Li, liver; Pa, pancreas (arrow); Sp, spleen; St, stomach; Pa/Li, pancreas-to-liver ratio; Pa/Sp, pancreas-to-spleen ratio; Pa/Du, pancreas-to-duodenum ratio. All NIR fluorescence images have identical exposure times and normalizations.


