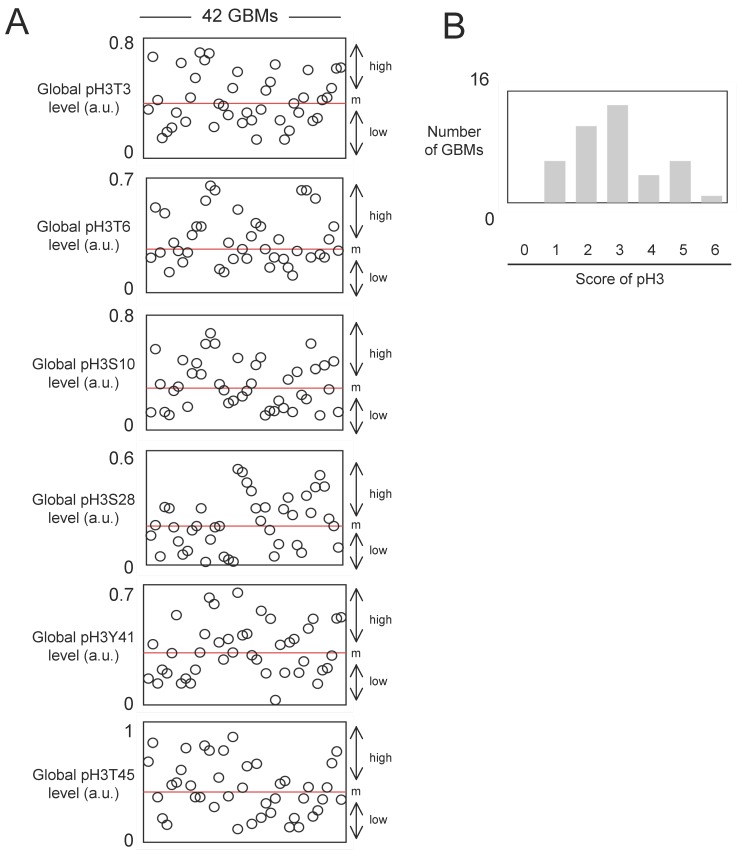
Figure 1.
Study of the global level of pH3T3, pH3T6, pH3S10, pH3S28, pH3Y41 and pH3T45 in 42 GBMs. (A) After extraction of histone, ELISA experiments were realized to estimate the considered phosphorylation levels of histone H3. Each open circle represents a GBM. m: median. (B) The core of pH3 reflects the accumulation of several types of histone H3 phosphorylation in a same GBM. Thus, graph 1B illustrates the number of GBM presenting an accumulation of histone H3 phosphorylation.

