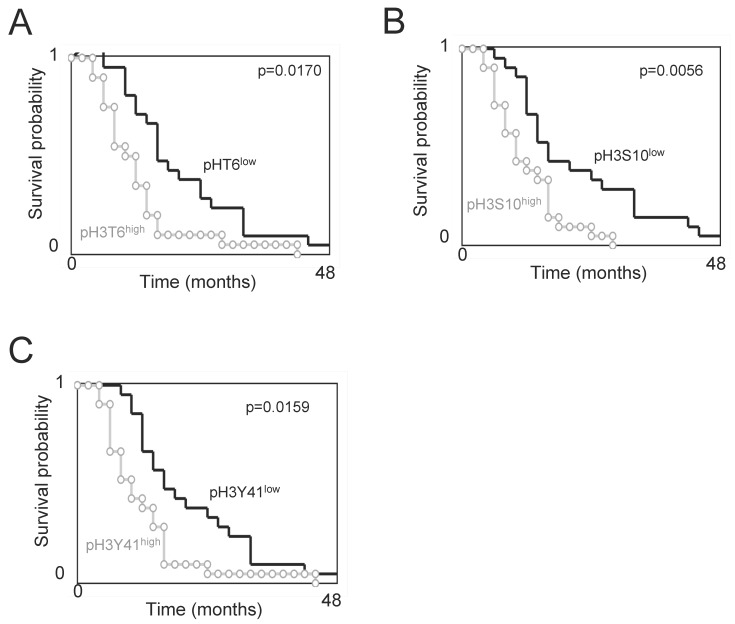
Figure 2.
Overall survival (OS) vs. subgroups of phospho-histone H3. Kaplan-Meier curves illustrate the significant difference in OS between patients with tumors harboring a low or high level of pH3T6 (A), pH3S10 (B) or pH3Y41 (C). The level of pH3T6, pH3S10 or pH3Y41 used are the ones obtained by ELISA. Significant difference was estimated via a Cox Proportional Hazards Survival Regression Analysis. For considered level of pH3, the “low” subgroup includes GBMs having a level of pH3 inferior or equal to the median value, and the “high” subgroup includes GBMs having a level of pH3 superior to the median value.

