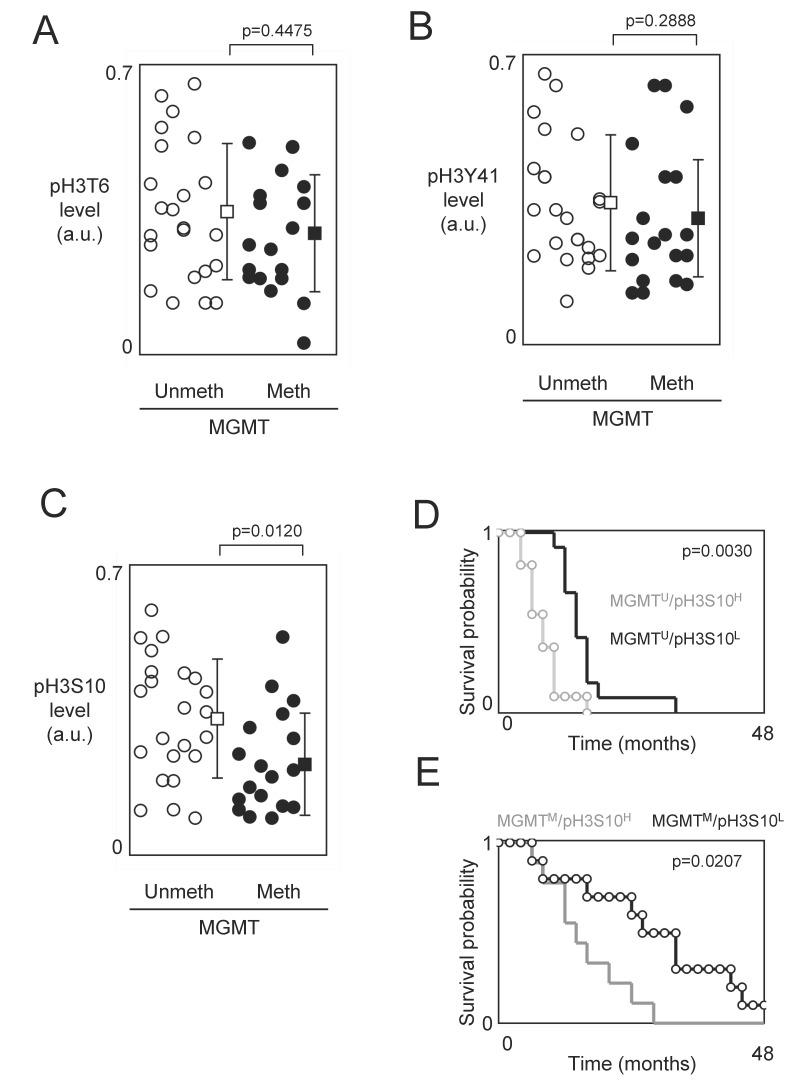
Figure 3.
Study of the phosphorylation level of H3T6, H3S10 and H3Y41 in function of the methylation status of the MGMT gene. (A-B-C) Graphs illustrate the level of pH3T6 (A), pH3Y41 (B) and pH3S10 (C) in GBMs previously characterized by the presence of unmethylated MGMT gene or methylated MGMT gene. Open circles represent GBMs presenting an unmethylated MGMT gene. Black circles represent GBMs presenting a methylated MGMT gene. Open square represents the average±standard deviation of GBMs presenting an unmethylated MGMT gene. Black square represents the average±standard deviation of GBMs presenting a methylated MGMT gene. (D-E) Kaplan-Meier curves illustrate the significant difference in overall survival between patients whose tumors had MGMTM/pH3S10H and those whose tumors had MGMTM/pH3S10H (E), and between patients whose tumors had MGMTM/pH3S10H and those whose tumors had MGMTM/pH3S10H (D).

