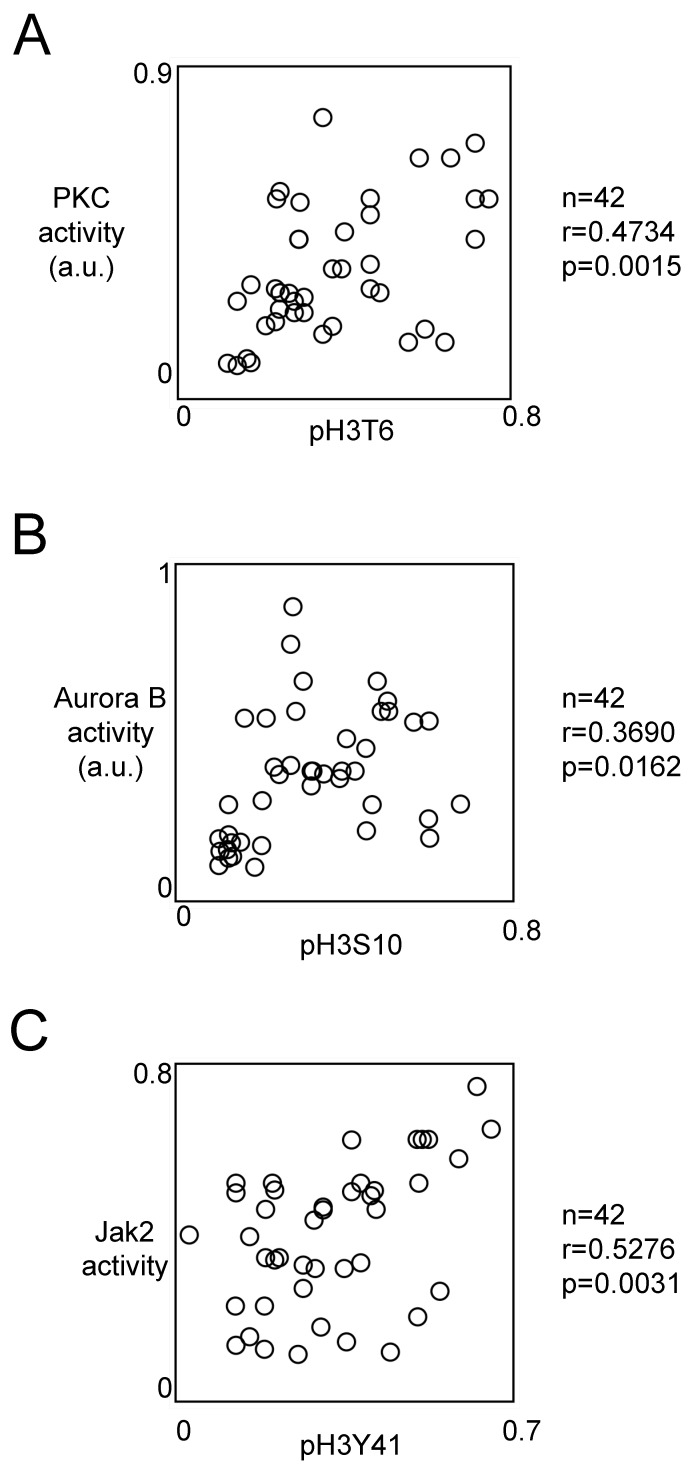
Figure 4.
Correlation between the phosphorylation level of H3T6, H3S10 and H3Y41 and the activity of kinases implicated into these phosphorylations. Graphs illustrates the correlation existing between the PKC activity and the pH3T6 level (A), the Aurora-B activity and the pH3S10 level (B) and between the Jak2 activity and the pH3Y41 level (C). Correlation analyses were realized by using the Pearson's correlation test. The level of pH3T6, pH3S10 or pH3Y41 used are the ones obtained by ELISA. Kinase activity was obtained by using the HTScan® Jak2 Kinase Assay Kit, HTScan® Aurora B Kinase Assay Kit and HTScan® PKCβ Kinase Assay Kit (Ozyme, Cell Signaling, France) according to the manufacturer's instructions.

