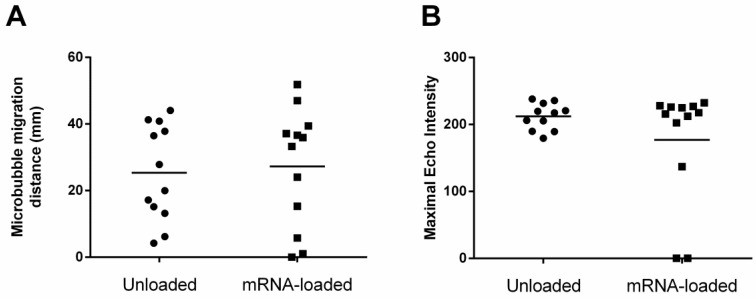
Figure 5.
Maximal migration distance and maximal echo intensity of mRNA-loaded and unloaded microbubbles. Scatterplots show (A) the linear migration distance of unloaded and mRNA-loaded microbubbles from the injection site and (B) the maximal echo intensities within the lymphatics for both microbubble types. For both parameters, no statistically significant differences between unloaded and mRNA-loaded microbubbles could be detected.

