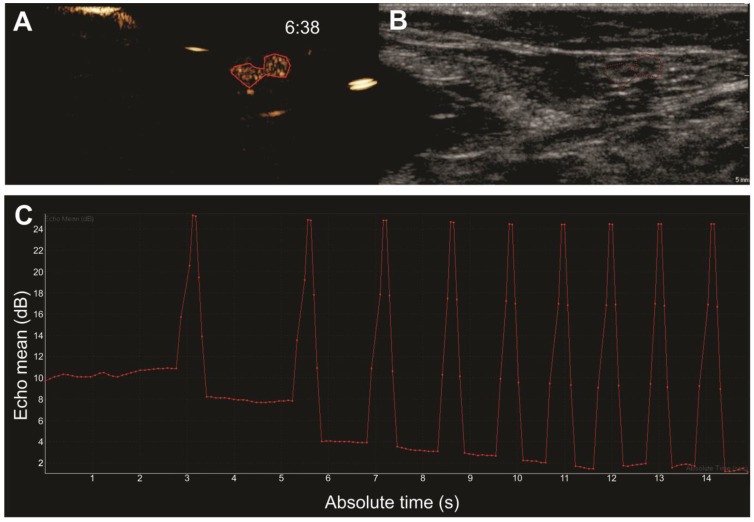
Figure 7.
Burst destruction of intranodal microbubbles. After visualization of unloaded microbubble drainage, the scanner's burst function was used to destroy the microbubbles within the lymphatics. Images show (A) CEUS image with a ROI drawn around a lymph node filled with mRNA-loaded microbubbles and (B) the corresponding B-mode image. Burst analysis is represented in (C) as the echo mean (dB), where each burst is visible as an echo mean peak, followed by a reduction of the contrast echo mean. Time after mRNA-loaded microbubble injection is noted on the CEUS images (in min:s).

