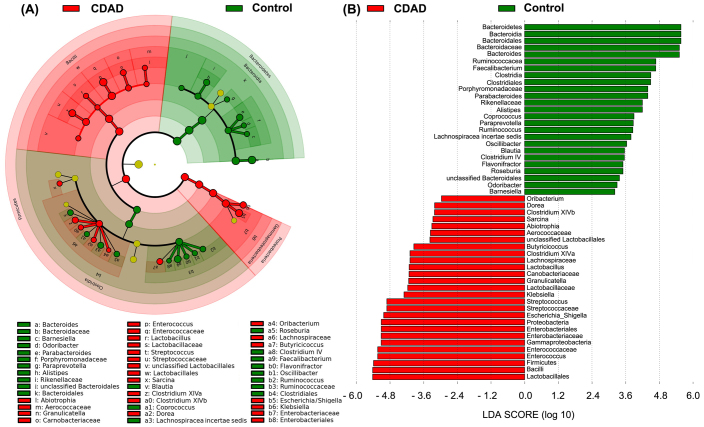
Figure 3. LEfSe identified the most differentially abundant taxons between healthy controls and patients with CDAD.
Taxonomic cladogram obtained from LEfSe analysis of 16S sequences (relative abundance ≥ 0.5%). (Red) CDAD-enriched taxa; (Green) taxa enriched in healthy controls. The brightness of each dot is proportional to its effect size (A). Healthy control-enriched taxa are indicated with a positive LDA score (green), and taxa enriched in CDAD have a negative score (red). Only taxa meeting an LDA significant threshold >2 are shown (B).

