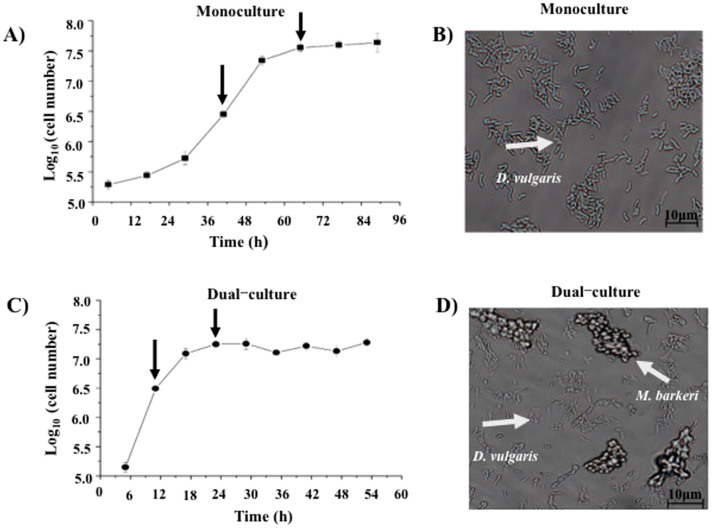
Figure 1.
Growth curves of D. vulgaris in monoculture (A) and syntrophic dual-culture with M. barkeri (C). In addition, the microscopic photos of monoculture (B) and syntrophic dual-culture with M. barkeri (D) were also provided. The arrows in plot (A) and (C) indicated the sampling time points for single-cell RT-qPCR analysis. In plot (B) and (D), D. vulgaris and M. barkeri were indicted, respectively.

