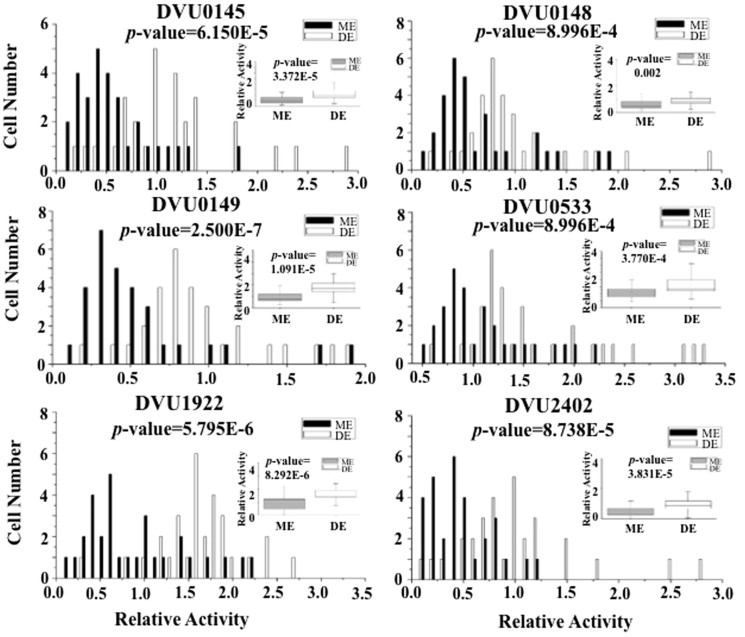
Figure 3. Gene-expression distributions of target genes at exponential phase in monoculture and syntrophic dual-culture.
ME and DE are abbreviations for exponential phase in monoculture and syntrophic dual-culture, respectively. P-values in the histograms were determined by using the nonparametric two-sample Kolmogorov-Smirnov test between monoculture and syntrophic dual-culture (α = 0.05). The x axis shows the relative activity of a specific gene compared with the internal reference gene DVU1090 in the same cell, and the y axis shows the number of cells that have the same relative activity. P-values in the box plots were calculated by means of the two-tailed nonparametric Mann-Whitney statistical significance test between monoculture and syntrophic dual-culture. Box plots of single-cell gene expression levels and P-values associated with the differences between monoculture and syntrophic dual-culture. Box plot shows following statistical values: Open square – mean, solid line – median, upper and lower box lines – the 75th and 25th percentiles, respectively. Top and bottom short line – maximal and minimal values, respectively.

