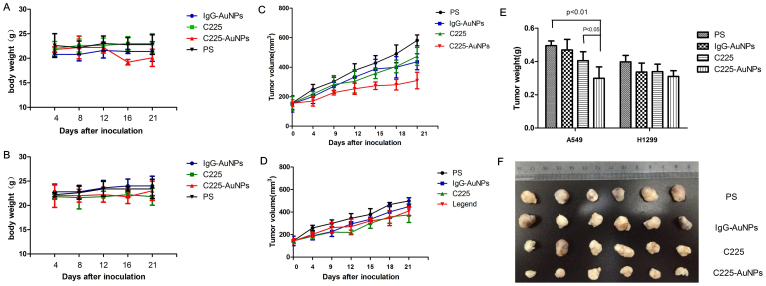
Figure 8. Antitumor effects of IgG-AuNPs, C225 and C225-AuNPs in a mouse lung cancer model.
(A): Body weight of A549 tumor-bearing mice treated with physiologic saline (PS), C225, IgG-AuNPs and C225-AuNPs. (B): Body weight of H1299 tumor-bearing mice (C): Tumor growth curves of A549 tumor-bearing mice. (D): Tumor growth curves of H1299 tumor-bearing mice; (E): Individual tumor weights from four groups of mice; (F): Images of tumors from four groups after sacrificing mice at day 21. Data are expressed as the mean ± SD (n = 6). (**p < 0.01; *p < 0.05).

