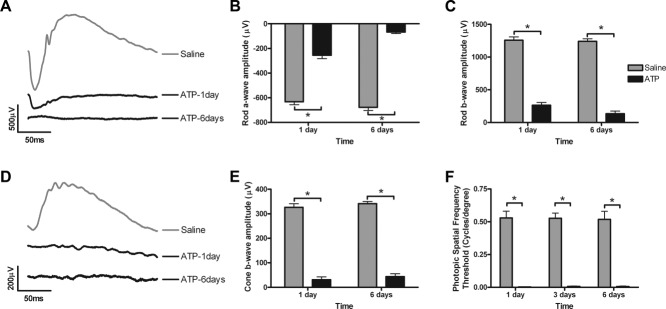
Figure 1.

Time course of the effects of 50 mM ATP on retinal function at 1 and 6 days. Twin, full-field 2.1 log cd · second/m2 intensity flashes were used to isolate the rod and cone pathway electroretinogram responses of saline- and ATP-treated eyes. A: Representative rod pathway waveforms from saline-treated (gray) and ATP-treated (black) eyes. Rod a-wave amplitude (B) and rod b-wave amplitude (C) were assessed for saline-treated (gray bar, n = 9) and ATP-treated (black, n = 9) eyes at 1 and 6 days after intravitreal injection. D: Representative cone pathway waveforms from saline-treated (gray) and ATP-treated (black) eyes. E: Cone b-wave amplitudes were assessed for saline-treated (gray bar, n = 9) and ATP-treated (black, n = 9) eyes at 1 and 6 days after intravitreal injection. F: Spatial frequency threshold in saline- and ATP-treated eyes was assessed under photopic conditions using the optokinetic response at 1, 3, and 6 days after injection. Significance of P < 0.05 between saline- and ATP-treated eyes indicated by an asterisk.
