
Figure 2.
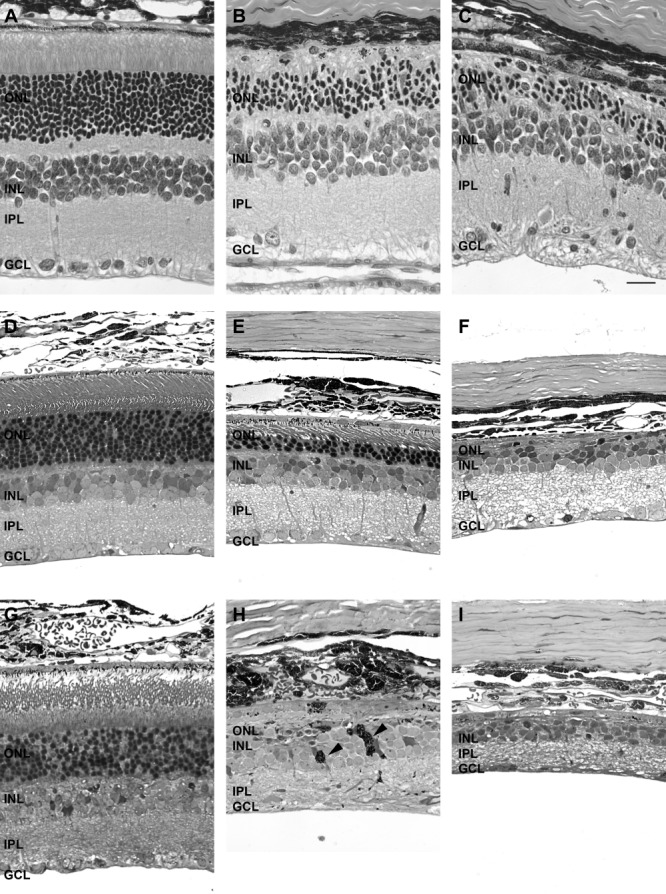
Time course of the effects of 50 mM ATP on the gross structure of the retina at 1 week, 3 months, and 6 months. Gross retinal structure was assessed in saline-treated and ATP-treated regions of retina at 1 week (A: saline; B,C: ATP, paraffin), 3 months (D: saline; E,F: ATP, resin), and 6 months (G: saline; H,I: ATP, resin). For each time point, two example regions of ATP-treated retinae are presented. Arrowheads in H indicate aberrant pigmented (RPE) cells within the neural retina. ONL, outer nuclear layer; INL, inner nuclear layer; IPL, inner plexiform layer; GCL, ganglion cell layer. Scale bar = 20 μm.